Indy: Evals and AI Agents to search the Amazon for lost civilizations
My submission for OpenAI's City of Z competition
The challenge entails finding evidence of pre-Columbian civilizations in the Amazon using OpenAI's models and open-access data sources like LIDAR, multispectral imagery, and historical records. Here's what I did and what I found!
My efforts were based on 3 simple ideas
- My research pointed to two strong signals: geoglyphs/earthworks in lidar, and signs of terra preta in multispectral data. Everything else I found was either too sparse or not informative enough.
- Tokens are cheap, o3 is pretty smart, and if you spend more tokens, you should expect to see better results! So I wanted to construct my agents such that they spend more time (tokens) on the most interesting sites!
- Constructing good evals: You can give o3 an image of the DEM from a lidar tile and ask it to find patterns in it. But how can you be confident in its answer? I tuned prompts on tiles with confirmed sites and tiles with no known sites. Then I used the known-site list to reduce the risk of rediscovering existing finds.
What I did
- Aggregated lidar tile data from 14 datasets (3787 total tiles) and processed them to create DEM and z-score normalized images
- Compiled a list of confirmed archaeological sites within the Amazon region (4787 total earthwork and terra preta sites)
- Constructed Evals for earthwork detection using lidar data.
- Constructed Evals for terra preta detection using Sentinel 2, HydroSHEDS, CHIRPS, and Mapbox data.
- Ran o3 (with prompts and tools tuned via evals) on 3749 lidar tiles (all our tiles minus the ones we used for our evals). These tiles did not have any confirmed archaeological sites within them.
- Prepared a curated list of 200+ papers for Deep Research queries
What I found
We found 507 probable and 8 very likely new earthwork sites in lidar tiles with no previously reported archaeological sites!
We ran our eval-tuned prompts/tools on all the lidar tiles (after removing the confirmed and control tiles).
Given the nature of our prompts, the model scores a site:
- 6-8: Probable archaeological site
- 9-10: Definite archaeological site
For our test case, the model gave:
- 507 tiles a score of more than 5 (13.5% of the total tiles)
- 8 tiles a score of more than 8! (0.2%)
How I prepared my data
Before we begin constructing our evals, we need to:
- Compile a database of lidar tiles
- Compile a list of all known earthwork and terra preta sites!
We used the following sources:
Lidar Tiles
- LiDAR Surveys over Selected Forest Research Sites, Brazilian Amazon, 2008-2018
- Aerial LiDAR data from French Guiana, Paracou, November 2019
- Aerial LiDAR data from French Guiana, Nouragues, November 2019
- LiDAR survey on 250 hectares in Jari, Amapá, Brazil, 2021.
- LiDAR survey on 1038 hectares in GEDI, Amazonas, Brazil, 2021.
- LiDAR survey on 765 hectares in Tumbira, Pará, Brazil, 2021.
- LiDAR survey on 2400 hectares in São Sebastião do Uatumã, Amazonas, Brazil, 2021.
- LiDAR and DTM Data from Forested Land Near Manaus, Amazonas, Brazil, 2008
- LiDAR and DTM Data from Tapajos National Forest in Para, Brazil, 2008
- LiDAR survey on 176.2 hectares in Ucayali, Peru in 2017.
- LiDAR survey on 223.5 hectares in Ucayali, Peru in 2017.
- LiDAR survey on 374.7 hectares in Ucayali, Peru in 2017.
- LiDAR survey on 586.32 hectares in Barcelos II, Amazonas, Brazil in 2014.
- LiDAR survey on 244 hectares in Ucayali, Peru in 2017.
Confirmed Archaeological Sites
(We filter these sites to be within our defined Amazon boundary.)
- Geometry by Design: Contribution of Lidar to the Understanding of Settlement Patterns of the Mound Villages in SW Amazonia
- Geolocation of unpublished archaeological sites in the Peruvian Amazon
- James Q. Jacobs - ArchaeoBlog
- IPHAN Database
- Casarabe culture sites
- Pre-Columbian earth-builders settled along the entire southern rim of the Amazon
- Predicting the geographic distribution of ancient Amazonian archaeological sites with machine learning
- Data from: More than 10,000 pre-Columbian earthworks are still hidden throughout Amazonia
- A "Dirty" Footprint: Soil macrofauna biodiversity and fertility in Amazonian Dark Earths and adjacent soils
Control Datasets
Pre-LBA RADAMBRASIL Project Data
For sites in the Amazon with no known terra preta.
Important caveat: I tried to collect every public dataset I could find, but private or missing datasets could invalidate some results. If you know of any I missed, especially near my result areas, please let me know!
Constructing good evals
Lidar Evals
Now, to construct our evals, we prepared 2 lists:
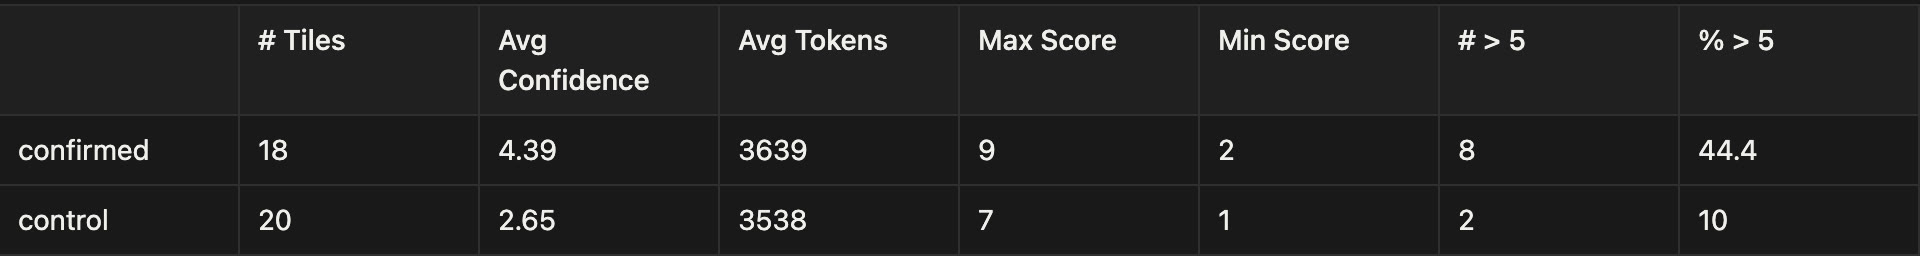
- Confirmed: a set of LIDAR tiles that are known to have at least one confirmed archaeological site. This gave us a set of 18 tiles (Amazon is massive, and this tells you how sparse publicly available data is!)
- Control: 20 random lidar tiles outside the confirmed set. I tried very, very hard to find a database of Amazon areas or LIDAR tiles with no known earthworks, but I couldn't find one. Random sampling was the best available control.
I tuned my prompts on the confirmed and control tiles. The goal was to maximize correct guesses and confidence on confirmed tiles, while minimizing both on control tiles.
I ran a lot of experiments, and for each experiment, we simply tracked the average score on the confirmed sites and the control sites. We ran with different reasoning efforts, different max output tokens, different dem images, different prompts, etc.
Key insights:
- Setting the reasoning effort to high led to worse outcomes. Average confidence score on our confirmed set decreased, and the control score increased!
- We ran our analysis with
max_tokens = 20,000. Setting a higher limit did not change anything, as the average tokens consumed per tile was around ~3500. - Using the code interpreter made the performance noticeably worse. Moreover, a lot of tiles started getting flagged as inappropriate (best guess is that the color scheme we used for our z-score normalized images looks too much like flesh when zoomed in lol)
- What worked best was default settings, reasoning set to medium, giving the model the z-score normalized images, DEM terrain colored images, and a simple recipe on how to analyze it.
- Note: We did not change the prompts/tools during or after our test runs.
Our best eval run gave us:
Important:
A key problem I had come to realize at this point was that the quality of the data we have is not perfect at all!
- We have point coordinates of known archaeological sites, not polygons! This is not ideal for earthworks
- The data lacks temporal precision. A source might report a site without saying when or how it was found, so newer imagery may reflect changed land use rather than the original site.
- For our control set, the biggest issue is that there is a risk of accidentally sampling a tile where the model does see a pattern!
So the most reliable way to tune my prompts when running evals was to rely a little bit on what I saw in the data. Spending time looking at JPEGs of my z-score and DEMs was very useful and a better proxy! Example:
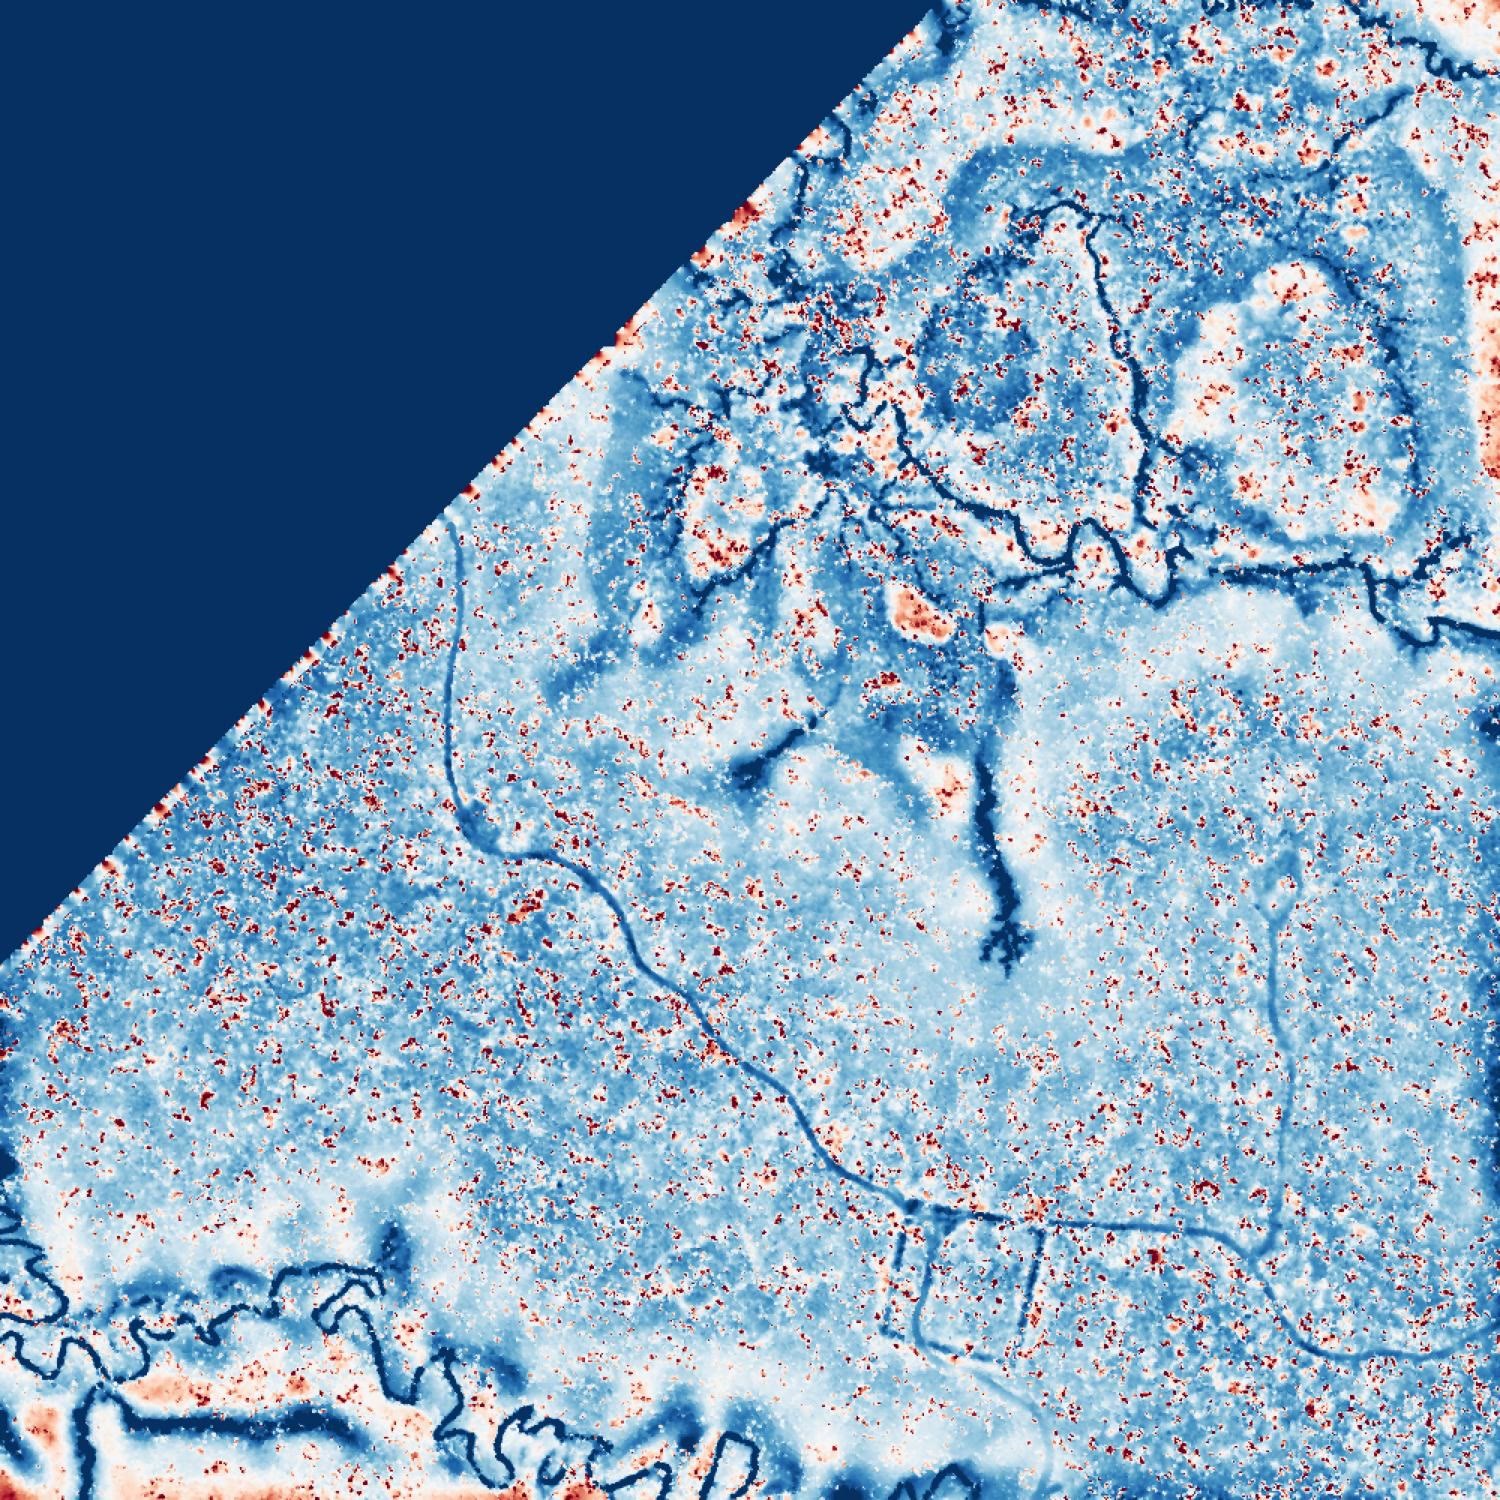
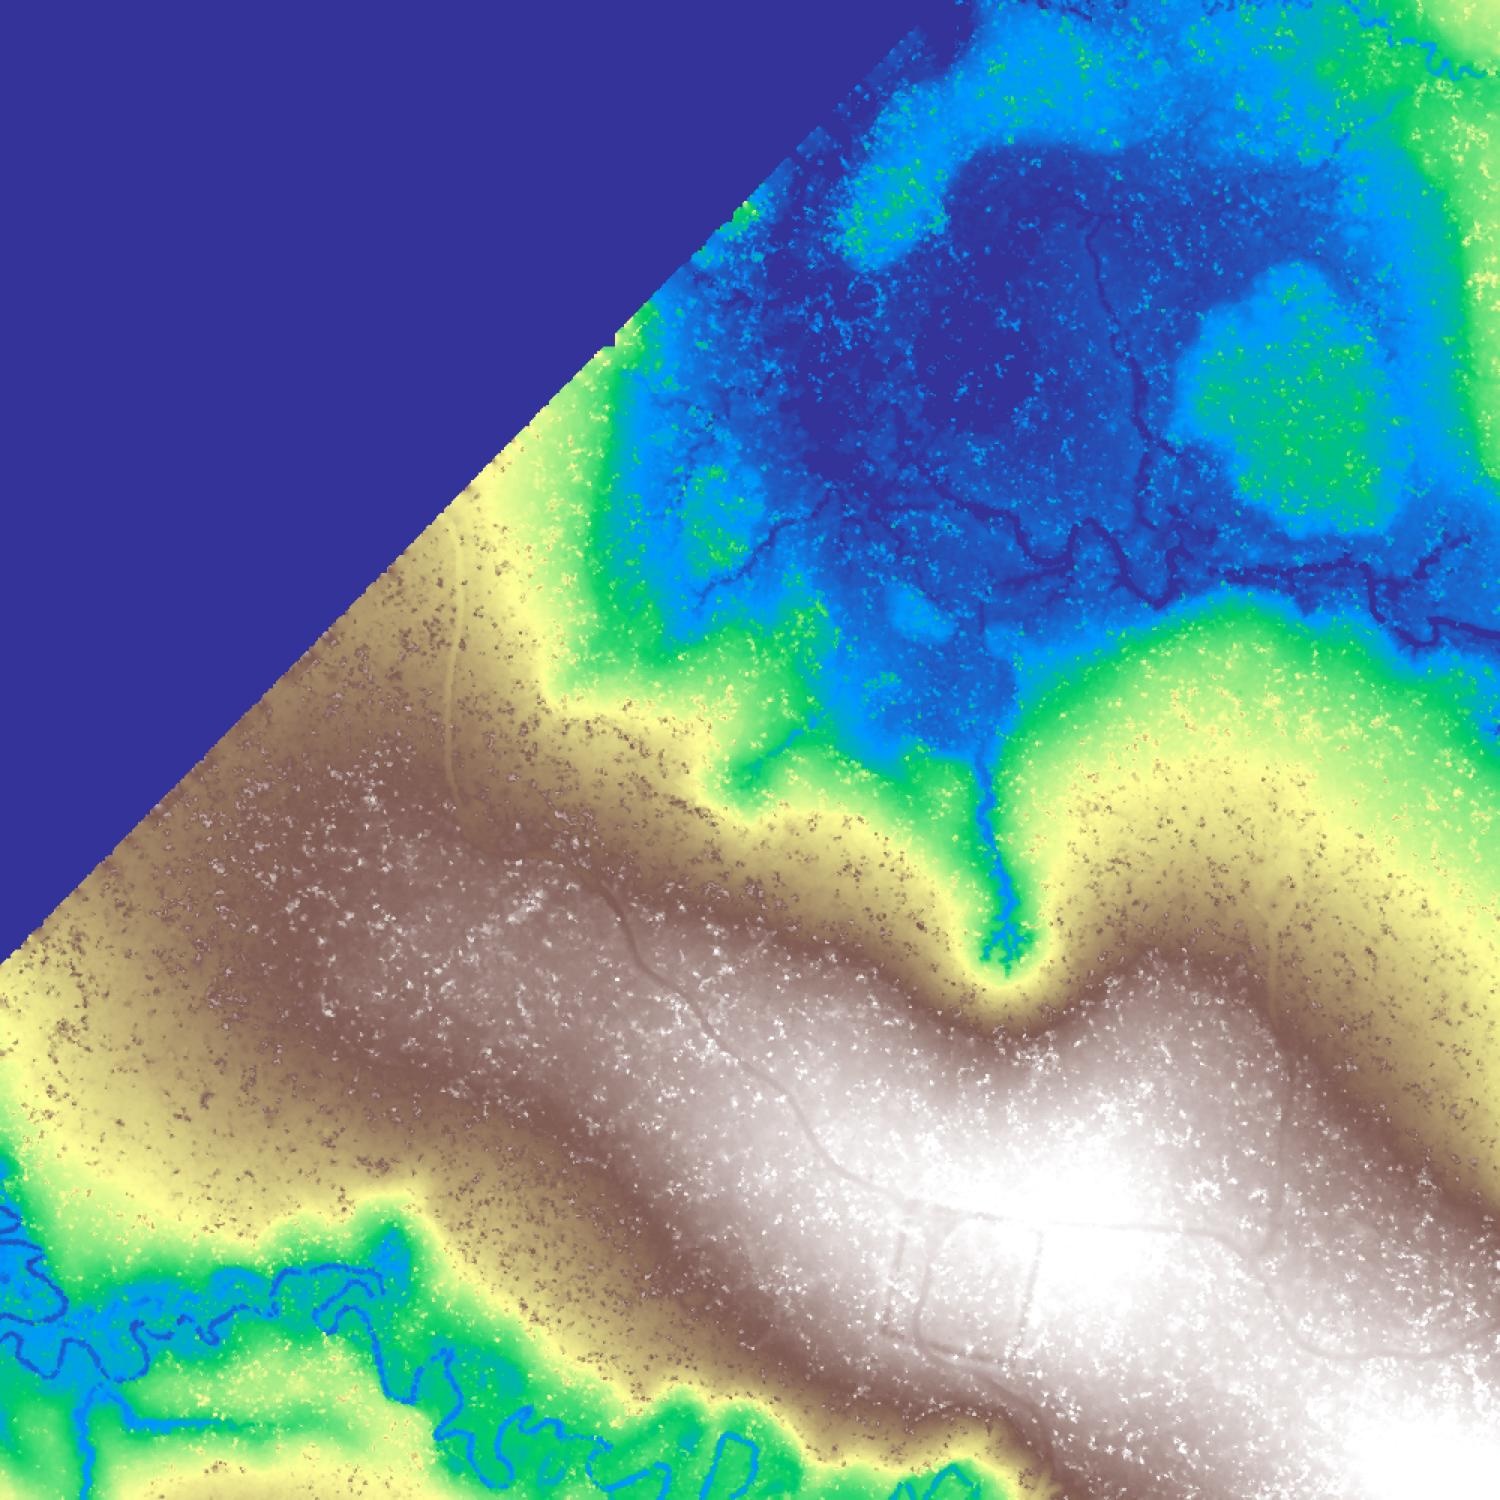
The scores may not look impressive at first. But if you inspect the data I provided, the highest-scoring confirmed tiles usually show visible patterns, while low-scoring confirmed tiles often do not. The same pattern holds for controls.
Terra Preta Evals
My motivation for this was to see if O3 could detect signs of terra preta. What I did:
- I filtered my dataset of confirmed sites to those marked as containing terra preta (ADE)
- Then, for each site, I created a 1km x 1km square grid around it and collected a lot of information for each square grid.
- I also collected a list of "control" sites, sites I know for a fact do not contain terra preta via Pre-LBA RADAMBRASIL Project Data.
- I focused on analyzing the dry months of 2024, as there was a severe drought in the Amazon during that time, and my bet was that terra preta signals would be accentuated during this time. My system prompt for this goes into detail.
The agent I created had access to the following tools:
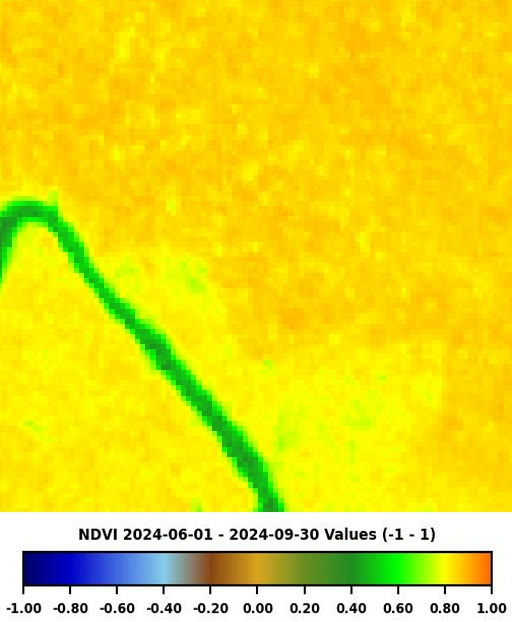
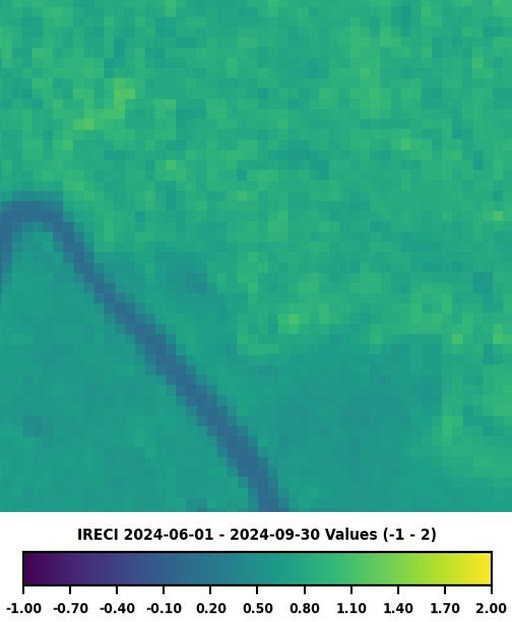
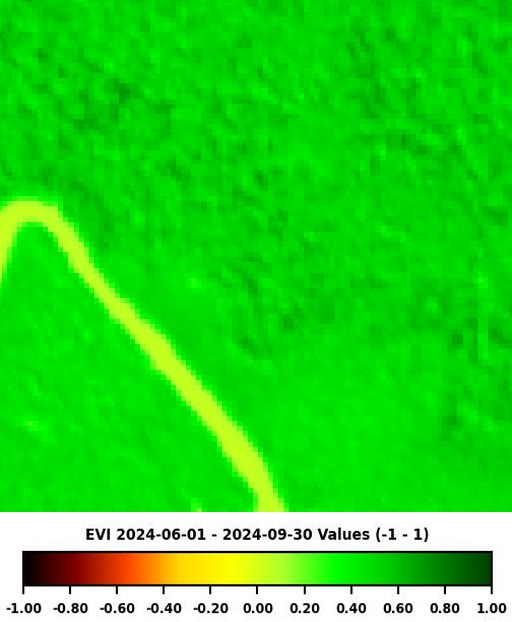
get_vegetation_indices: NDVI, EVI, IRECI from Sentinel 2
- Why: These indices let the model compare vegetation patterns across dates and neighboring cells. That helps it establish a local baseline instead of reasoning from some generic idea of "forest".
get_precipitation_report: We want the model to be able to see how much it rained every month in a given year in the AOI and its neighbors.
It also received the following information in the user prompt:
- Information on whether there is a river within 5km of it (size 4-7)
- This is important since terra preta sites are usually found near elevated bluffs
- We use hydroshed dataset from GEE for this
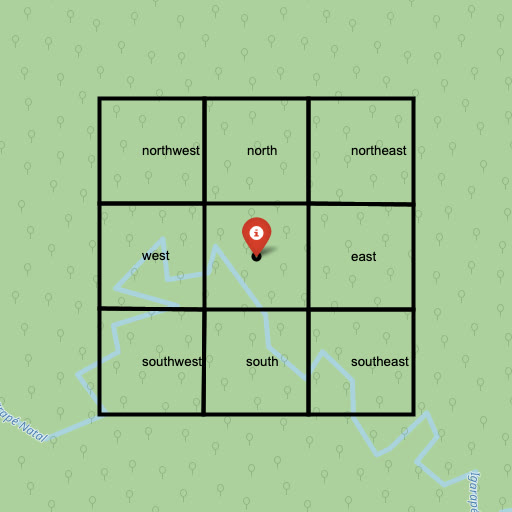
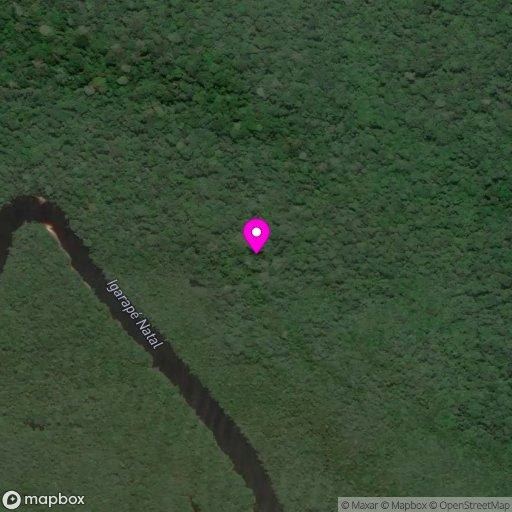
- It received a Mapbox satellite image to inspect what the square grid looked like: whether it was forested, developed, sloped, etc.
- A map of neighboring cells: Terra preta detection depends on spotting unusual vegetation patterns. The model needed nearby cells as a local baseline, so I let it decide which neighbors to inspect.
The tools were made to be flexible by design. I wanted to give the model the freedom to investigate neighbors, different periods, different indices, etc.
I wanted to spend the most amount of time on the most interesting areas!
Example images of what the model saw:
(The vegetation-index images are blurry because the target sites are small. Terra preta sites can be only a few hectares, Sentinel-2 tops out at 10m per pixel, and OpenAI processes images in 512x512 patches.)
Now, for our evals:
- We have square grids that we know have terra preta, and square grids where we know there is no terra preta.
- Unfortunately, when I ran this on a sample of 50 confirmed and 50 control areas, the results were 50/50.
| Category | Count | Min | Max | Mean | Median |
|---|---|---|---|---|---|
| All Cells | 99 | 1 | 6 | 2.99 | 3 |
| Confirmed | 49 | 1 | 6 | 2.92 | 3 |
| Control | 50 | 1 | 6 | 3 | 3 |
I believe this is either due to:
- The resolution of our data is not good enough. Terra Preta sites are usually a few hectares at most, and given the scale of Sentinel 2 data, it would be a tiny fraction of the total image size
- The confirmed site data was not good. As we mentioned earlier, the data we have for Amazon is not that good or precise.
- My prompts aren't performing well (I tried a lot of things to improve the evals, but couldn't)
- We are not looking at the right proxies of terra preta
We did not conduct a test run, so our contribution here is to essentially show that O3 and multispectral data are very weak at detecting signs of terra preta.
Deep Research Queries
Deep Research helped me refine prompts and understand earthwork and terra preta signals. I collected 200+ papers in a Google Drive folder and used them as research context. I have shared a few deep research links that helped me understand how to interpret lidar data for earthworks and multispectral data for terra preta!
Link to my papers: https://drive.google.com/drive/folders/1U7BpldZW72dT6Ru4ZG9ojmOifdnjzJIz?usp=sharing
- https://chatgpt.com/share/6861b528-b058-8005-9a2a-27f54c65ead0
- https://chatgpt.com/share/6861b548-aa34-8005-a471-d3b0fdb04edd
- https://chatgpt.com/share/6861b550-a1e4-8005-9954-bcb91363aa8b
Potential next steps
Having shown how good my pipeline is for lidar processing and detecting earthworks, it makes sense to run it on all available lidar data for the Amazon!
The only datasets I found but did not run were too large to process:
- L1A - Discrete airborne LiDAR transects collected by EBA in the Brazilian Amazon (Acre e Rondônia)
- L1A - Discrete airborne LiDAR transects collected by EBA in the Brazilian Amazon (Maranhão e Tocantins)
- L1A - Discrete airborne LiDAR transects collected by EBA in the Brazilian Amazon (Roraima e Amapá)
- L1A - Discrete airborne LiDAR transects collected by EBA in the Brazilian Amazon (Mato Grosso, Amazonas e Pará)
An idea I had no time to pursue: Epidemic hypothesis
Would epidemic-related population collapses (1540-1600) have left detectable phosphorus signatures from mass burials? I wonder if hyperspectral analysis could pick up these century-old chemical scars as a proxy for lost settlements. Here's my reasoning (and assumptions) on why mass burials/concentrated deaths likely occurred:
Historical Foundation (1540-1600): During the demographic collapse (~80% mortality from disease), normal burial practices would have broken down due to:
- Overwhelming death rates outpacing traditional funeral rites
- Too few healthy people to handle bodies properly
- Fear of contagion (similar to Black Death and 1918 flu responses)
- Bodies likely concentrated in houses (died in place) or hasty communal burials
The Phosphorus Math:
- For a settlement of 5,000 people with 80% mortality concentrated in a 12,000-15,000 m² area: 4,000 deaths × 650g phosphorus/person = ~2,600 kg phosphorus
- Amazon background: 50-200 mg/kg P
- Predicted enrichment: 347 mg/kg (2-7× background) [assuming concentration in 15,000m² area, 0.5m soil depth]
- Expected persistence after 500 years: 200-280 mg/kg due to Fe/Al oxide binding [based on archaeological studies showing 60-80% retention in acidic tropical soils]
(I have tried to underestimate my numbers to account for mistakes/uncertainty)
Why It Should Persist:
- The acidic Amazon soils (pH 4-5) actually help preserve the signal - phosphorus binds immediately to iron/aluminum oxides, creating permanent deposits. Also, terra preta sites have significantly elevated phosphorus and those sites could be way older!
Detection Potential:
- Modern hyperspectral satellites can detect 10-20% differences in soil chemistry. These epidemic signatures would be 150-250% above background - well within detection range.
Things that kill the theory (outside of my assumptions being incorrect):
- Soil erosion and other disturbances may have diluted the phosphorus
- No way to reliably detect phosphorus via hyperspectral imagery
Replicate
I have tried to be very careful with this: every config setting has a documented reason, and the code is easy to replicate and debug. Just send me an email and I'll give you the code!